Map

How the prior art connects

The report moves from independent signal families to leakage gates, then into repo-by-repo adoption decisions.

I Executive stack II Leakage gates III Signal families IV-X Population and welfare XI-XVIII Graph and imagery XIX-XXX India geodata Read downward: choose independent signals, prove they are leakage-safe, then promote only gated prior art into TAM workstreams.
IUse the executive stack to keep model families separate.
IIReject metrics that skip leakage and spatial/city holdouts.
IIIMap each repo to feature families before implementation.
IV+Promote a prior art only after source, coverage, and outcome gates pass.
Vocabulary

Things this doc uses

Vendor TAM

A benchmark or evaluation label only; never a production feature.

Spatial holdout

A validation split that withholds geographic areas, not random rows.

City holdout

A validation split that tests whether the model survives unseen cities.

Denominator

The population, household, or building base before ability-to-buy adjustments.

Serviceability

Whether the business can feasibly reach or install in the cell.

Acquirability

Whether demand can be won through channels, price, and competition.

OSM completeness

A guardrail that separates missing map data from missing demand.

GeoHG

A heterogeneous graph prior art for area, semantic, and POI context.

Prior art landscapeEditorial explainerLeakage-gated TAM

A reader for the operator who has to decide what belongs in the model

India grid TAM prediction: a prior-art reader

A standalone research map for the local prior-art corpus. It separates population, welfare, POI, road, land-mask, graph, and business-reality layers so GeoIQ-style vendor TAM remains a benchmark label rather than a production input.

Prior arts 27
Source records 22
GeoHG nodes 7029
GeoHG edges 24198
read
Understand the signal stack before any repo is promoted.
gate
Keep leakage checks and city holdouts beside every metric.
map
Route each prior art to a TAM feature family and owner.
adopt
Use only versioned sources with coverage and outcome validation.
I Chapter one - the stack pp. 1-4

Executive Map

The practical stack is not one model. It is a controlled sequence of independent denominator, welfare, activity, serviceability, graph context, and internal outcome layers.

You are here in the mindmap
This section belongs to Map 1 - stack order.
Story role

Name the layers before choosing tools.

Carry forward

A repo is useful only after it is tied to a specific layer and validation gate.

grouped by: independent signals denominator and welfare context roads, POIs, graphs gates leakage and holdouts
family 01

Population Household Denominator

TAM cannot be right if the denominator is wrong; this is the first reality anchor.

Validation target: district/city household and population rollups, then internal serviceable households

family 02

Buildings And Settlement Structure

Separates dense residential demand from empty land, industrial sheds, and underbuilt cells.

Validation target: audited buildings/households and installable address density

family 03

Satellite Welfare Affluence

Maps visible welfare and housing quality into the target-income/affordability band.

Validation target: Census/SECC/NFHS/SHRUG welfare indicators and internal ARPU/plan affordability

family 04

Nightlights And Economic Activity

Captures economic intensity and electrification that pure population misses.

Validation target: income/development proxies, leads, installs, ARPU, and retained revenue

family 05

Roads Accessibility Serviceability

Converts theoretical demand into reachable/serviceable demand.

Validation target: serviceability pass/fail, failed installs, partner travel time, network coverage

family 06

Poi Urban Function

Distinguishes residential <10 LPA opportunity cells from purely commercial, industrial, or sparse cells.

Validation target: lead density, conversion, install density, and local ops knowledge

family 07

Land Use Exclusions And Risk

Prevents false TAM where households cannot or should not exist.

Validation target: manual QA, failed installs, low-address-density cells, and land/water masks

family 08

Heterogeneous Graph And Spatial Context

Replaces leaky neighbor-TAM interpolation with independent neighbour/context features.

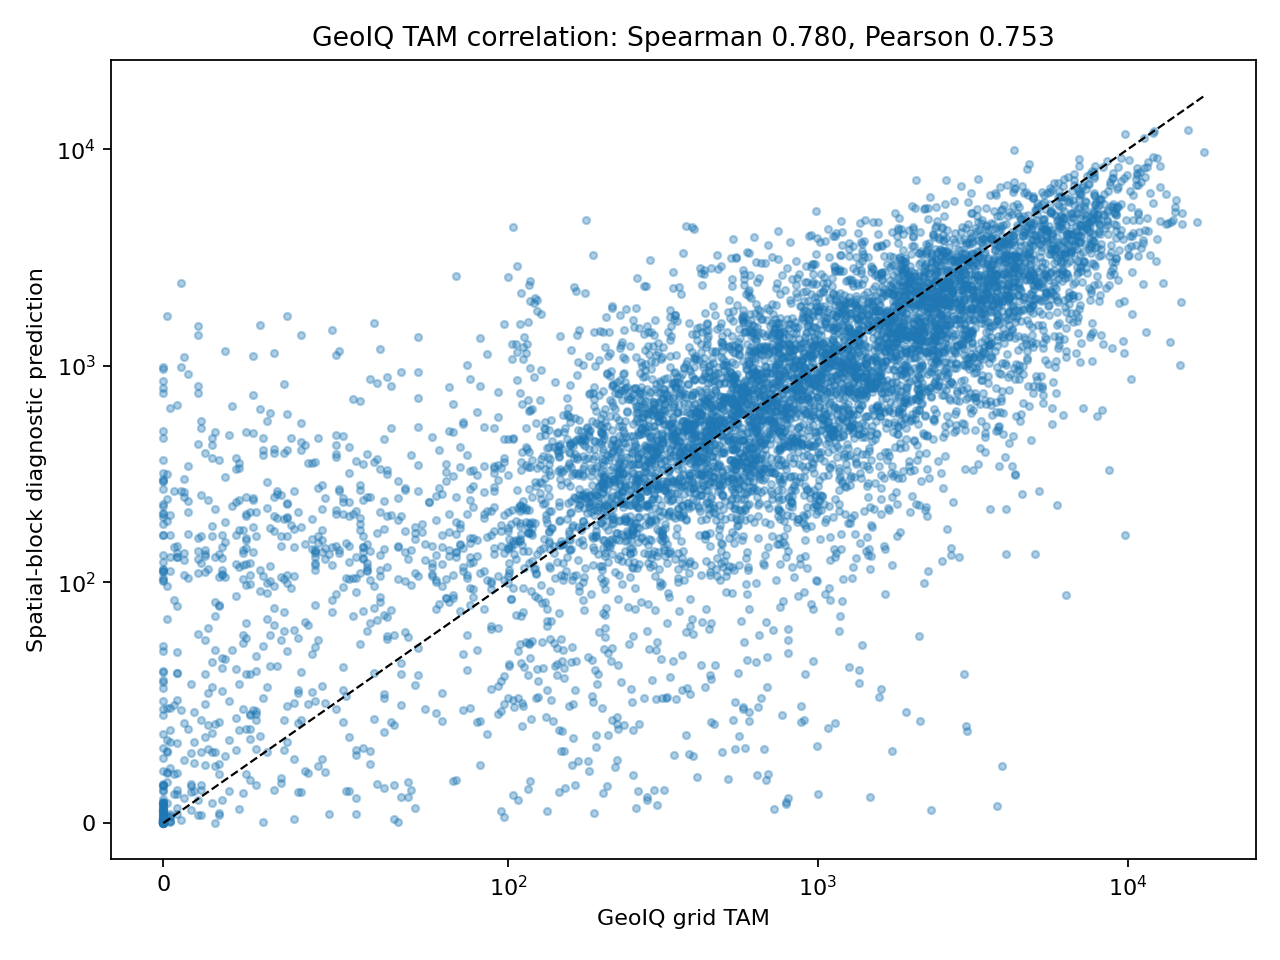
Validation target: spatial-block holdout against vendor TAM and real business outcomes

family 09

Internal Business Reality

This is the actual business reality layer; without it, confidence is only proxy confidence.

Validation target: time-based and spatial-block holdout outcomes

II Chapter two - validity pp. 5-8

Metric And Leakage Context

This report keeps the repository rule intact: do not present optimistic metrics without leakage checks. The useful GeoHG-style numbers are spatial-block and city holdouts; random CV remains a diagnostic warning.

You are here in the mindmap
This section belongs to Map 2 - validity gates.
Story role

Separate diagnostic metrics from defensible methodology claims.

Carry forward

Any prior-art adoption must preserve the no-vendor-TAM-feature policy.

Vendor TAM is a benchmark label for evaluation and distillation research. It is not allowed as a production score feature, neighbor aggregate, target-derived rank, or tuning signal.

Accepted diagnostic metrics Full spatial block Spearman 0.855 Full city holdout Spearman 0.775 Semantic spatial block Spearman 0.844 Semantic city holdout Spearman 0.766 Random CV is shown in this project only as a leakage warning when coordinates or position surfaces are present.
manifest

Current GeoHG-style feature manifest

  • Status: ok
  • Vendor TAM used as feature: False
  • Vendor TAM used for evaluation only: True
  • WorldCover raster available: False
local figure

Generated local visual artifact

The existing scatter plot is linked below when the HTML is opened from the outputs directory.

GeoHG-style correlation scatter plot from local outputs
III Chapter three - routing pp. 9-12

Prior-Art Signal Stack

Each family below names the prior-art repos that matter, the signal it contributes, and the validation target that must pass before it becomes more than research context.

You are here in the mindmap
This section belongs to Map 3 - feature families.
Story role

Convert repo names into auditable workstreams.

Carry forward

Every later repo section should point back to at least one family here.

Feature family Repos Signals Why it matters Validation target
population household denominator prs-eth/Popcorn, yashveeeeeeer/india-geodata, devdatalab/shrug-public, pigshell/india-census-2011 WorldPop population, census/SHRUG reconciliation, built-up occupancy, household density TAM cannot be right if the denominator is wrong; this is the first reality anchor. district/city household and population rollups, then internal serviceable households
buildings and settlement structure ramSeraph/indian_buildings, yashveeeeeeer/india-geodata, prs-eth/Popcorn building_count, built_area_share, building_density, occupancy_proxy, settlement_compactness Separates dense residential demand from empty land, industrial sheds, and underbuilt cells. audited buildings/households and installable address density
satellite welfare affluence AIandGlobalDevelopmentLab/EOML-for-India, amangupt01/Village_Development_Model, mani-shailesh/satimage, torchgeo/torchgeo roof/material proxy, lighting proxy, drinking-water proxy, Landsat/Sentinel embeddings, village development score Maps visible welfare and housing quality into the target-income/affordability band. Census/SECC/NFHS/SHRUG welfare indicators and internal ARPU/plan affordability
nightlights and economic activity amangupt01/Village_Development_Model, yashveeeeeeer/india-geodata, devdatalab/shrug-public VIIRS mean, VIIRS trend, nightlight blob score, commercial activity proxy Captures economic intensity and electrification that pure population misses. income/development proxies, leads, installs, ARPU, and retained revenue
roads accessibility serviceability kraina-ai/srai, Calychas/highway2vec, yashveeeeeeer/india-geodata, ramSeraph/indian_land_features road_length_by_class, distance_to_major_road, road_embedding, travel_friction, non-serviceable terrain Converts theoretical demand into reachable/serviceable demand. serviceability pass/fail, failed installs, partner travel time, network coverage
poi urban function kraina-ai/srai, kraina-ai/hex2vec, PaddlePaddle/PaddleSpatial, yashveeeeeeer/india-geodata POI counts by category, Hex2Vec/ContextualCount embeddings, schools/healthcare/markets, urban function vector Distinguishes residential <10 LPA opportunity cells from purely commercial, industrial, or sparse cells. lead density, conversion, install density, and local ops knowledge
land use exclusions and risk ramSeraph/indian_land_features, yashveeeeeeer/india-geodata water_share, forest_share, mining_share, industrial_land_share, flood/coastal risk, slope/elevation Prevents false TAM where households cannot or should not exist. manual QA, failed installs, low-address-density cells, and land/water masks
heterogeneous graph and spatial context CityMind-Lab/GeoHG, kraina-ai/srai, seai-lab/TorchSpatial, wherobots/GeoTorchAI neighbor context, semantic similarity, land-cover hypernodes, POI hypernodes, location encoders Replaces leaky neighbor-TAM interpolation with independent neighbour/context features. spatial-block holdout against vendor TAM and real business outcomes
internal business reality firm internal data, not GitHub leads, installs, retained installs, gross margin, CAC, failed installs, serviceability checks, capacity This is the actual business reality layer; without it, confidence is only proxy confidence. time-based and spatial-block holdout outcomes

Each repo chapter below answers what the prior art does, what it consumes, what it emits, how it maps to TAM, and what must be validated before use.

IV Prior art 01 - Graph socioeconomic inference pp. 13-15

GeoHG: heterogeneous graphs for socioeconomic indicators

Turns geographic raster/vector features into a heterogeneous graph with area nodes, semantic entity hypernodes, POI hypernodes, and spatial adjacency.

You are here in the mindmap
This section belongs to Map 4 - Graph socioeconomic inference.
Story role

Decide whether this repo supplies a production input, a challenger, or context only.

Carry forward

Promote only the outputs that survive source versioning, leakage checks, and outcome validation.

classification priority 1 Graph socioeconomic inference Closest methodological fit heterogeneous graph and spatial context poi urban function land use exclusions and risk
source custody

Local path: prior art/CityMind-Lab_GeoHG

Upstream: CityMind-Lab/GeoHG

inputs
grid cells, land cover, POIs
method
Uses message passing to combine local neighborhood context with global semantic similarity across land-cover or POI categories.
outputs
grid predictions, graph embeddings, area-area edges
tam use
Use it to encode independent spatial context without using neighbor vendor TAM.
gate
vendor_tam_used_as_feature must be false
Inputs stage 1 Processing stage 2 Features stage 3 Validation stage 4 TAM use stage 5 population household denominator buildings and settlement structure satellite welfare affluence nightlights and economic activity roads accessibility serviceability poi urban function land use exclusions and risk heterogeneous graph and spatial context internal business reality Signal coverage sketch cells, sources, and validation gates must be versioned before modeling 1 2 3 4 5 6 7 Graph and crosswalk lens Graph socioeconomic inference
what it does

Core Behavior

  • Turns geographic raster/vector features into a heterogeneous graph with area nodes, semantic entity hypernodes, POI hypernodes, and spatial adjacency.
  • Uses message passing to combine local neighborhood context with global semantic similarity across land-cover or POI categories.
  • Targets socioeconomic indicators such as population, GDP, night light, PM2.5, and carbon from spatial inputs.
  • Provides a direct conceptual template for the local GeoHG-style feature builder already used in this repository.
model input

Inputs

  • grid cells
  • land cover
  • POIs
  • raster indicators
  • observed indicator labels
model output

Outputs

  • grid predictions
  • graph embeddings
  • area-area edges
  • entity-area edges
  • POI-area edges
tam role

How It Helps TAM

  • Use it to encode independent spatial context without using neighbor vendor TAM.
  • Preserve area-area adjacency and semantic hyperedges for soil, land use, POIs, flood risk, and nightlight bins.
  • Evaluate only with spatial-block and city holdouts before any business claim.
promotion gate

Validation Gates

  • vendor_tam_used_as_feature must be false
  • random CV is leakage warning only when position encodings exist
  • city holdout and no-position semantic runs must be reported
watch

Risks And Caveats

  • Full GNN training can hide leakage if labels or GeoIQ-derived aggregates enter node features.
  • Coordinates can dominate if not separated from semantic features.
fit bars

Feature-Family Fit

population household denominator

buildings and settlement structure

satellite welfare affluence

nightlights and economic activity

roads accessibility serviceability

poi urban function

land use exclusions and risk

heterogeneous graph and spatial context

internal business reality

V Prior art 02 - Population denominator pp. 16-18

POPCORN: population from Sentinel imagery and coarse census counts

Estimates high-resolution population maps from Sentinel-1 and Sentinel-2 imagery with a small number of coarse census counts.

You are here in the mindmap
This section belongs to Map 5 - Population denominator.
Story role

Decide whether this repo supplies a production input, a challenger, or context only.

Carry forward

Promote only the outputs that survive source versioning, leakage checks, and outcome validation.

classification priority 1 Population denominator Strong denominator challenger population household denominator buildings and settlement structure
source custody

Local path: prior art/prs-eth_Popcorn

Upstream: prs-eth/Popcorn

inputs
Sentinel-1, Sentinel-2, coarse census totals
method
Separates built-up extraction from occupancy modeling, which helps distinguish populated residential area from empty built-up land.
outputs
population density, built-up map, occupancy proxy
tam use
Use as the population/household denominator challenger against WorldPop, Census, SHRUG, and building redistribution.
gate
district and city rollups must reconcile against official totals
Inputs stage 1 Processing stage 2 Features stage 3 Validation stage 4 TAM use stage 5 population household denominator buildings and settlement structure satellite welfare affluence nightlights and economic activity roads accessibility serviceability poi urban function land use exclusions and risk heterogeneous graph and spatial context internal business reality Signal coverage sketch cells, sources, and validation gates must be versioned before modeling 1 2 3 4 5 6 7 Graph and crosswalk lens Population denominator
what it does

Core Behavior

  • Estimates high-resolution population maps from Sentinel-1 and Sentinel-2 imagery with a small number of coarse census counts.
  • Separates built-up extraction from occupancy modeling, which helps distinguish populated residential area from empty built-up land.
  • Produces interpretable population, built-up, and occupancy outputs that can be aggregated to 100 m, 1 km, or H3 cells.
  • Includes inference, training, and data preparation paths for reproducible population mapping in data-scarce regions.
model input

Inputs

  • Sentinel-1
  • Sentinel-2
  • coarse census totals
  • boundary rasters
model output

Outputs

  • population density
  • built-up map
  • occupancy proxy
  • population change map
tam role

How It Helps TAM

  • Use as the population/household denominator challenger against WorldPop, Census, SHRUG, and building redistribution.
  • Treat occupancy as a residential confidence input, not as income truth.
  • Aggregate predictions to H3 and vendor-compatible grid cells after source versioning.
promotion gate

Validation Gates

  • district and city rollups must reconcile against official totals
  • building occupancy must be audited against address/install density
  • imagery windows must be pinned before evaluation
watch

Risks And Caveats

  • Population is not TAM until income band, serviceability, and acquirability are estimated.
  • Transfer from non-India training areas needs validation.
fit bars

Feature-Family Fit

population household denominator

buildings and settlement structure

satellite welfare affluence

nightlights and economic activity

roads accessibility serviceability

poi urban function

land use exclusions and risk

heterogeneous graph and spatial context

internal business reality

VI Prior art 03 - Geospatial feature engineering toolkit pp. 19-21

SRAI: spatial representations for artificial intelligence

Downloads and processes OSM, Overture, GTFS, vector data, microregions, and embeddings.

You are here in the mindmap
This section belongs to Map 6 - Geospatial feature engineering toolkit.
Story role

Decide whether this repo supplies a production input, a challenger, or context only.

Carry forward

Promote only the outputs that survive source versioning, leakage checks, and outcome validation.

classification priority 1 Geospatial feature engineering toolkit Production-friendly toolkit poi urban function roads accessibility serviceability heterogeneous graph and spatial context
source custody

Local path: prior art/kraina-ai_srai

Upstream: kraina-ai/srai

inputs
OSM, Overture Maps, GTFS
method
Provides H3 and other regionalization, loaders, embedders, datasets, and visualization utilities.
outputs
region feature tables, spatial embeddings, H3 vectors
tam use
Use it to standardize H3 feature construction for roads, POIs, OSM tags, and region embeddings.
gate
OSM/Overture extract date must be recorded
Inputs stage 1 Processing stage 2 Features stage 3 Validation stage 4 TAM use stage 5 population household denominator buildings and settlement structure satellite welfare affluence nightlights and economic activity roads accessibility serviceability poi urban function land use exclusions and risk heterogeneous graph and spatial context internal business reality Signal coverage sketch cells, sources, and validation gates must be versioned before modeling 1 2 3 4 5 6 7 Graph and crosswalk lens Geospatial feature engineering toolkit
what it does

Core Behavior

  • Downloads and processes OSM, Overture, GTFS, vector data, microregions, and embeddings.
  • Provides H3 and other regionalization, loaders, embedders, datasets, and visualization utilities.
  • Implements or supersedes Hex2Vec and related geospatial embedding pipelines.
  • Turns raw spatial layers into reusable region vectors for downstream models.
model input

Inputs

  • OSM
  • Overture Maps
  • GTFS
  • H3 cells
  • POIs
  • roads
  • buildings
model output

Outputs

  • region feature tables
  • spatial embeddings
  • H3 vectors
  • benchmark datasets
tam role

How It Helps TAM

  • Use it to standardize H3 feature construction for roads, POIs, OSM tags, and region embeddings.
  • Pair its embeddings with transparent counts so reason codes remain explainable.
  • Use dated extracts rather than live OSM pulls for modeling runs.
promotion gate

Validation Gates

  • OSM/Overture extract date must be recorded
  • coverage null rates must be reported by city and state
  • embeddings must be compared to count baselines
watch

Risks And Caveats

  • OSM sparsity can look like low demand unless completeness is separately measured.
  • Embeddings are hard to explain without companion feature counts.
fit bars

Feature-Family Fit

population household denominator

buildings and settlement structure

satellite welfare affluence

nightlights and economic activity

roads accessibility serviceability

poi urban function

land use exclusions and risk

heterogeneous graph and spatial context

internal business reality

VII Prior art 04 - OSM/H3 embeddings pp. 22-24

Hex2Vec: H3 region embeddings from OSM tags

Learns context-aware embeddings for H3 hexagons from OpenStreetMap tags.

You are here in the mindmap
This section belongs to Map 7 - OSM/H3 embeddings.
Story role

Decide whether this repo supplies a production input, a challenger, or context only.

Carry forward

Promote only the outputs that survive source versioning, leakage checks, and outcome validation.

classification priority 2 OSM/H3 embeddings Superseded by SRAI but conceptually important poi urban function heterogeneous graph and spatial context
source custody

Local path: prior art/kraina-ai_hex2vec

Upstream: kraina-ai/hex2vec

inputs
H3 cells, OSM tags, neighbor context
method
Uses neighboring regions to produce urban function vectors from map features.
outputs
hex embeddings, urban function vectors, similarity maps
tam use
Use for urban function vectors that separate residential, commercial, education, market, and sparse cells.
gate
dated OSM extract required
Inputs stage 1 Processing stage 2 Features stage 3 Validation stage 4 TAM use stage 5 population household denominator buildings and settlement structure satellite welfare affluence nightlights and economic activity roads accessibility serviceability poi urban function land use exclusions and risk heterogeneous graph and spatial context internal business reality Signal coverage sketch cells, sources, and validation gates must be versioned before modeling 1 2 3 4 5 6 7 Graph and crosswalk lens OSM/H3 embeddings
what it does

Core Behavior

  • Learns context-aware embeddings for H3 hexagons from OpenStreetMap tags.
  • Uses neighboring regions to produce urban function vectors from map features.
  • Frames POI and land-use context as a representation learning problem rather than manual indicators only.
  • Acts as the conceptual basis for SRAI-style region embedders.
model input

Inputs

  • H3 cells
  • OSM tags
  • neighbor context
  • regional graph
model output

Outputs

  • hex embeddings
  • urban function vectors
  • similarity maps
tam role

How It Helps TAM

  • Use for urban function vectors that separate residential, commercial, education, market, and sparse cells.
  • Compare embedding clusters with manual reason-code categories.
  • Use only after source completeness flags are attached.
promotion gate

Validation Gates

  • dated OSM extract required
  • embedding clusters must be inspected manually
  • must not tune embedding choice on GeoIQ TAM correlation
watch

Risks And Caveats

  • The original repo is not maintained; use SRAI for implementation.
  • Sparse OSM regions can create false negatives.
fit bars

Feature-Family Fit

population household denominator

buildings and settlement structure

satellite welfare affluence

nightlights and economic activity

roads accessibility serviceability

poi urban function

land use exclusions and risk

heterogeneous graph and spatial context

internal business reality

VIII Prior art 05 - Road accessibility embeddings pp. 25-27

Highway2Vec: road-network representations for microregions

Represents OSM microregions through road network characteristics.

You are here in the mindmap
This section belongs to Map 8 - Road accessibility embeddings.
Story role

Decide whether this repo supplies a production input, a challenger, or context only.

Carry forward

Promote only the outputs that survive source versioning, leakage checks, and outcome validation.

classification priority 2 Road accessibility embeddings Useful road morphology reference roads accessibility serviceability
source custody

Local path: prior art/Calychas_highway2vec

Upstream: Calychas/highway2vec

inputs
OSM roads, microregions, road classes
method
Builds road feature datasets and trains autoencoder-style embeddings for road morphology.
outputs
road embeddings, road-density features, microregion similarity
tam use
Use for reachability, install feasibility, service cost, partner routing, and dense-lane indicators.
gate
validate against failed installs and serviceability checks
Inputs stage 1 Processing stage 2 Features stage 3 Validation stage 4 TAM use stage 5 population household denominator buildings and settlement structure satellite welfare affluence nightlights and economic activity roads accessibility serviceability poi urban function land use exclusions and risk heterogeneous graph and spatial context internal business reality Signal coverage sketch cells, sources, and validation gates must be versioned before modeling 1 2 3 4 5 6 7 Graph and crosswalk lens Road accessibility embeddings
what it does

Core Behavior

  • Represents OSM microregions through road network characteristics.
  • Builds road feature datasets and trains autoencoder-style embeddings for road morphology.
  • Turns street structure, density, and connectivity into compact vectors.
  • Offers a pathway from raw road geometries to serviceability and accessibility features.
model input

Inputs

  • OSM roads
  • microregions
  • road classes
  • network topology
model output

Outputs

  • road embeddings
  • road-density features
  • microregion similarity
tam role

How It Helps TAM

  • Use for reachability, install feasibility, service cost, partner routing, and dense-lane indicators.
  • Pair with explicit road length by class and distance-to-major-road features.
  • Use as a serviceable TAM component rather than gross demand.
promotion gate

Validation Gates

  • validate against failed installs and serviceability checks
  • compare road embeddings to transparent road counts
  • document OSM road coverage per city
watch

Risks And Caveats

  • Road density can mark commercial/industrial corridors, not residential TAM.
  • Road network availability differs by mapping quality.
fit bars

Feature-Family Fit

population household denominator

buildings and settlement structure

satellite welfare affluence

nightlights and economic activity

roads accessibility serviceability

poi urban function

land use exclusions and risk

heterogeneous graph and spatial context

internal business reality

IX Prior art 06 - Remote-sensing ML backbone pp. 28-30

TorchGeo: PyTorch datasets, samplers, transforms, and geospatial models

Provides PyTorch-native geospatial datasets, samplers, transforms, trainers, and pretrained models.

You are here in the mindmap
This section belongs to Map 9 - Remote-sensing ML backbone.
Story role

Decide whether this repo supplies a production input, a challenger, or context only.

Carry forward

Promote only the outputs that survive source versioning, leakage checks, and outcome validation.

classification priority 1 Remote-sensing ML backbone Core remote-sensing toolkit satellite welfare affluence land use exclusions and risk buildings and settlement structure
source custody

Local path: prior art/torchgeo_torchgeo

Upstream: torchgeo/torchgeo

inputs
Landsat, Sentinel, raster labels
method
Handles geospatial metadata, CRS alignment, raster sampling, dataset intersection, and large-image patch workflows.
outputs
imagery embeddings, land-cover models, segmentation masks
tam use
Use for built-up texture, land-cover masks, settlement morphology, and satellite welfare residual features.
gate
image source manifest and CRS must be locked
Inputs stage 1 Processing stage 2 Features stage 3 Validation stage 4 TAM use stage 5 population household denominator buildings and settlement structure satellite welfare affluence nightlights and economic activity roads accessibility serviceability poi urban function land use exclusions and risk heterogeneous graph and spatial context internal business reality Signal coverage sketch cells, sources, and validation gates must be versioned before modeling 1 2 3 4 5 6 7 Graph and crosswalk lens Remote-sensing ML backbone
what it does

Core Behavior

  • Provides PyTorch-native geospatial datasets, samplers, transforms, trainers, and pretrained models.
  • Handles geospatial metadata, CRS alignment, raster sampling, dataset intersection, and large-image patch workflows.
  • Supports classification, regression, segmentation, detection, and change detection tasks.
  • Makes satellite feature extraction repeatable when transparent tabular baselines need imagery features.
model input

Inputs

  • Landsat
  • Sentinel
  • raster labels
  • masks
  • patch samplers
model output

Outputs

  • imagery embeddings
  • land-cover models
  • segmentation masks
  • remote-sensing features
tam role

How It Helps TAM

  • Use for built-up texture, land-cover masks, settlement morphology, and satellite welfare residual features.
  • Keep imagery models behind simpler baselines until residuals justify them.
  • Archive imagery source windows and train/validation split geometry.
promotion gate

Validation Gates

  • image source manifest and CRS must be locked
  • spatial holdouts required for every imagery model
  • compare to non-image transparent baseline
watch

Risks And Caveats

  • Random patch splits can leak local visual texture.
  • Pretrained embeddings may be hard to explain to business users.
fit bars

Feature-Family Fit

population household denominator

buildings and settlement structure

satellite welfare affluence

nightlights and economic activity

roads accessibility serviceability

poi urban function

land use exclusions and risk

heterogeneous graph and spatial context

internal business reality

X Prior art 07 - Scalable raster and spatiotemporal ML pp. 31-33

GeoTorchAI: spatiotemporal deep learning with PyTorch and Sedona

Combines PyTorch models with Apache Sedona preprocessing for raster imagery and spatiotemporal non-imagery data.

You are here in the mindmap
This section belongs to Map 10 - Scalable raster and spatiotemporal ML.
Story role

Decide whether this repo supplies a production input, a challenger, or context only.

Carry forward

Promote only the outputs that survive source versioning, leakage checks, and outcome validation.

classification priority 3 Scalable raster and spatiotemporal ML Use when scale/time justifies it satellite welfare affluence heterogeneous graph and spatial context
source custody

Local path: prior art/wherobots_GeoTorchAI

Upstream: wherobots/GeoTorchAI

inputs
raster imagery, spatiotemporal grids, Spark/Sedona tables
method
Includes datasets, transforms, models, and scalable preprocessing patterns.
outputs
trained models, spatiotemporal predictions, raster features
tam use
Use only if H3 features become time-indexed and the project needs scalable raster/time processing.
gate
time split must be enforced
Inputs stage 1 Processing stage 2 Features stage 3 Validation stage 4 TAM use stage 5 population household denominator buildings and settlement structure satellite welfare affluence nightlights and economic activity roads accessibility serviceability poi urban function land use exclusions and risk heterogeneous graph and spatial context internal business reality Signal coverage sketch cells, sources, and validation gates must be versioned before modeling 1 2 3 4 5 6 7 Graph and crosswalk lens Scalable raster and spatiotemporal ML
what it does

Core Behavior

  • Combines PyTorch models with Apache Sedona preprocessing for raster imagery and spatiotemporal non-imagery data.
  • Includes datasets, transforms, models, and scalable preprocessing patterns.
  • Targets satellite classification/segmentation and spatiotemporal prediction tasks.
  • Fits larger data engineering workloads than a notebook-only pipeline.
model input

Inputs

  • raster imagery
  • spatiotemporal grids
  • Spark/Sedona tables
  • time series
model output

Outputs

  • trained models
  • spatiotemporal predictions
  • raster features
tam role

How It Helps TAM

  • Use only if H3 features become time-indexed and the project needs scalable raster/time processing.
  • Could support lead/install time windows, nightlight trends, and seasonal imagery inputs.
  • Keep simple pandas/geopandas pipeline until scale is the actual blocker.
promotion gate

Validation Gates

  • time split must be enforced
  • Spark/Sedona versions must be recorded
  • business outcome timestamps required for temporal claims
watch

Risks And Caveats

  • Heavier stack may slow auditability.
  • Not India-specific and not directly a TAM method.
fit bars

Feature-Family Fit

population household denominator

buildings and settlement structure

satellite welfare affluence

nightlights and economic activity

roads accessibility serviceability

poi urban function

land use exclusions and risk

heterogeneous graph and spatial context

internal business reality

XI Prior art 08 - Location representation and bias audit pp. 34-36

TorchSpatial: location encoders and geographic bias benchmarks

Implements a framework and benchmark suite for spatial representation learning.

You are here in the mindmap
This section belongs to Map 11 - Location representation and bias audit.
Story role

Decide whether this repo supplies a production input, a challenger, or context only.

Carry forward

Promote only the outputs that survive source versioning, leakage checks, and outcome validation.

classification priority 2 Location representation and bias audit Bias/coordinate encoder reference heterogeneous graph and spatial context
source custody

Local path: prior art/seai-lab_TorchSpatial

Upstream: seai-lab/TorchSpatial

inputs
coordinates, location labels, geo-aware image/regression datasets
method
Includes many location encoders, LocBench datasets, and geo-bias metrics.
outputs
location embeddings, benchmark metrics, geo-bias scores
tam use
Use to compare raw coordinates, city-relative coordinates, and learned location encoders.
gate
coordinate-only baseline must be reported
Inputs stage 1 Processing stage 2 Features stage 3 Validation stage 4 TAM use stage 5 population household denominator buildings and settlement structure satellite welfare affluence nightlights and economic activity roads accessibility serviceability poi urban function land use exclusions and risk heterogeneous graph and spatial context internal business reality Signal coverage sketch cells, sources, and validation gates must be versioned before modeling 1 2 3 4 5 6 7 Graph and crosswalk lens Location representation and bias audit
what it does

Core Behavior

  • Implements a framework and benchmark suite for spatial representation learning.
  • Includes many location encoders, LocBench datasets, and geo-bias metrics.
  • Separates coordinate encoding performance from geographic bias concerns.
  • Helps test whether a model is using useful spatial priors or memorizing location.
model input

Inputs

  • coordinates
  • location labels
  • geo-aware image/regression datasets
model output

Outputs

  • location embeddings
  • benchmark metrics
  • geo-bias scores
tam role

How It Helps TAM

  • Use to compare raw coordinates, city-relative coordinates, and learned location encoders.
  • Use geo-bias framing to explain why coordinate-only baselines are not enough.
  • Keep no-position semantic model alongside any coordinate-aware model.
promotion gate

Validation Gates

  • coordinate-only baseline must be reported
  • semantic/no-position model must be reported
  • city holdout must not collapse
watch

Risks And Caveats

  • Location encoders can become spatial lookup tables.
  • Strong coordinate fit does not mean business causality.
fit bars

Feature-Family Fit

population household denominator

buildings and settlement structure

satellite welfare affluence

nightlights and economic activity

roads accessibility serviceability

poi urban function

land use exclusions and risk

heterogeneous graph and spatial context

internal business reality

XII Prior art 09 - Urban computing toolkit pp. 37-39

PaddleSpatial: spatiotemporal computing and region profiling

Provides spatial-temporal data mining functions for transfer learning, time-series prediction, and region profiling.

You are here in the mindmap
This section belongs to Map 12 - Urban computing toolkit.
Story role

Decide whether this repo supplies a production input, a challenger, or context only.

Carry forward

Promote only the outputs that survive source versioning, leakage checks, and outcome validation.

classification priority 3 Urban computing toolkit Conceptual reference poi urban function heterogeneous graph and spatial context
source custody

Local path: prior art/PaddlePaddle_PaddleSpatial

Upstream: PaddlePaddle/PaddleSpatial

inputs
urban regions, spatiotemporal signals, POIs
method
Frames urban computing applications around reusable spatial and temporal feature modules.
outputs
region profiles, time-series predictions, urban computing features
tam use
Use as a reference for region profile modules and spatiotemporal abstractions.
gate
needs internal time-indexed outcomes
Inputs stage 1 Processing stage 2 Features stage 3 Validation stage 4 TAM use stage 5 population household denominator buildings and settlement structure satellite welfare affluence nightlights and economic activity roads accessibility serviceability poi urban function land use exclusions and risk heterogeneous graph and spatial context internal business reality Signal coverage sketch cells, sources, and validation gates must be versioned before modeling 1 2 3 4 5 6 7 Graph and crosswalk lens Urban computing toolkit
what it does

Core Behavior

  • Provides spatial-temporal data mining functions for transfer learning, time-series prediction, and region profiling.
  • Frames urban computing applications around reusable spatial and temporal feature modules.
  • Includes tutorials and API surfaces for broader region modeling.
  • Useful as a reference for region profiling, not as an India-specific data source.
model input

Inputs

  • urban regions
  • spatiotemporal signals
  • POIs
  • mobility or demand series
model output

Outputs

  • region profiles
  • time-series predictions
  • urban computing features
tam role

How It Helps TAM

  • Use as a reference for region profile modules and spatiotemporal abstractions.
  • Consider if internal outcomes become dense time series.
  • Do not treat it as a source of India geography.
promotion gate

Validation Gates

  • needs internal time-indexed outcomes
  • must be compared with simpler region profiles
  • source coverage must be independent of GeoIQ
watch

Risks And Caveats

  • Not tailored to the current India data stack.
  • May introduce framework complexity before needed.
fit bars

Feature-Family Fit

population household denominator

buildings and settlement structure

satellite welfare affluence

nightlights and economic activity

roads accessibility serviceability

poi urban function

land use exclusions and risk

heterogeneous graph and spatial context

internal business reality

XIII Prior art 10 - India-specific welfare modeling pp. 40-42

EOML-for-India: satellite imagery for Indian health and living standards

Reproduces research on measuring Indian living standards and health indicators from satellite images.

You are here in the mindmap
This section belongs to Map 13 - India-specific welfare modeling.
Story role

Decide whether this repo supplies a production input, a challenger, or context only.

Carry forward

Promote only the outputs that survive source versioning, leakage checks, and outcome validation.

classification priority 1 India-specific welfare modeling Strong India-specific welfare prior satellite welfare affluence population household denominator
source custody

Local path: prior art/AIandGlobalDevelopmentLab_EOML-for-India

Upstream: AIandGlobalDevelopmentLab/EOML-for-India

inputs
Indian village coordinates, Landsat imagery, Census labels
method
Downloads imagery, retrieves village image chips, cleans census labels, and trains models.
outputs
living-standard predictions, health proxy predictions, village image crops
tam use
Use as the India-specific welfare/affluence modeling template for income-band probability.
gate
village-to-cell crosswalk quality required
Inputs stage 1 Processing stage 2 Features stage 3 Validation stage 4 TAM use stage 5 population household denominator buildings and settlement structure satellite welfare affluence nightlights and economic activity roads accessibility serviceability poi urban function land use exclusions and risk heterogeneous graph and spatial context internal business reality Signal coverage sketch cells, sources, and validation gates must be versioned before modeling 1 2 3 4 5 6 7 Graph and crosswalk lens India-specific welfare modeling
what it does

Core Behavior

  • Reproduces research on measuring Indian living standards and health indicators from satellite images.
  • Downloads imagery, retrieves village image chips, cleans census labels, and trains models.
  • Uses Indian village geography and census-style indicators as welfare supervision.
  • Provides a strong template for satellite-to-welfare modeling in India.
model input

Inputs

  • Indian village coordinates
  • Landsat imagery
  • Census labels
  • NFHS-style indicators
model output

Outputs

  • living-standard predictions
  • health proxy predictions
  • village image crops
tam role

How It Helps TAM

  • Use as the India-specific welfare/affluence modeling template for income-band probability.
  • Map welfare outputs to H3 cells only after reconciling village/cell geometry.
  • Use as proxy confidence, not direct household income truth.
promotion gate

Validation Gates

  • village-to-cell crosswalk quality required
  • temporal split or city/state holdout needed
  • welfare target definitions must be documented
watch

Risks And Caveats

  • Village labels may not transfer directly to dense urban broadband TAM.
  • Historical census targets can be stale without calibration.
fit bars

Feature-Family Fit

population household denominator

buildings and settlement structure

satellite welfare affluence

nightlights and economic activity

roads accessibility serviceability

poi urban function

land use exclusions and risk

heterogeneous graph and spatial context

internal business reality

XIV Prior art 11 - India-specific rural and peri-urban development pp. 43-45

Village Development Model: Indian village imagery, nightlights, and population features

Downloads Indian state imagery through Google Earth Engine and cuts it into fixed village image crops.

You are here in the mindmap
This section belongs to Map 14 - India-specific rural and peri-urban development.
Story role

Decide whether this repo supplies a production input, a challenger, or context only.

Carry forward

Promote only the outputs that survive source versioning, leakage checks, and outcome validation.

classification priority 1 India-specific rural and peri-urban development Operational template for village-scale work satellite welfare affluence nightlights and economic activity population household denominator
source custody

Local path: prior art/amangupt01_Village_Development_Model

Upstream: amangupt01/Village_Development_Model

inputs
GEE imagery, village boundaries, census indicators
method
Builds census-derived development levels, population features, nightlight features, and nearest-neighbor features.
outputs
development scores, nightlight features, population features
tam use
Use for rural/peri-urban welfare proxy design and validation patterns.
gate
village imagery cloud and exclusion report required
Inputs stage 1 Processing stage 2 Features stage 3 Validation stage 4 TAM use stage 5 population household denominator buildings and settlement structure satellite welfare affluence nightlights and economic activity roads accessibility serviceability poi urban function land use exclusions and risk heterogeneous graph and spatial context internal business reality Signal coverage sketch cells, sources, and validation gates must be versioned before modeling 1 2 3 4 5 6 7 Graph and crosswalk lens India-specific rural and peri-urban development
what it does

Core Behavior

  • Downloads Indian state imagery through Google Earth Engine and cuts it into fixed village image crops.
  • Builds census-derived development levels, population features, nightlight features, and nearest-neighbor features.
  • Trains CNN and regression architectures for development indicators.
  • Includes hypothesis testing, visualizations, occlusion studies, error analysis, and statewise statistics.
model input

Inputs

  • GEE imagery
  • village boundaries
  • census indicators
  • VIIRS/nightlights
  • population features
model output

Outputs

  • development scores
  • nightlight features
  • population features
  • error analysis maps
tam role

How It Helps TAM

  • Use for rural/peri-urban welfare proxy design and validation patterns.
  • Borrow its nightlight and population feature engineering before training heavy imagery models.
  • Use occlusion/error analysis style for model interpretability.
promotion gate

Validation Gates

  • village imagery cloud and exclusion report required
  • spatial/state holdout required
  • development labels must not be used as current income truth without calibration
watch

Risks And Caveats

  • Village-scale development does not directly equal urban 0-10 LPA TAM.
  • GEE imagery exports need reproducible date windows.
fit bars

Feature-Family Fit

population household denominator

buildings and settlement structure

satellite welfare affluence

nightlights and economic activity

roads accessibility serviceability

poi urban function

land use exclusions and risk

heterogeneous graph and spatial context

internal business reality

XV Prior art 12 - Interpretable satellite welfare proxies pp. 46-48

satimage: poverty prediction from roof, lighting, water, and satellite imagery

Predicts developmental parameters from satellite images using a multi-task fully convolutional model.

You are here in the mindmap
This section belongs to Map 15 - Interpretable satellite welfare proxies.
Story role

Decide whether this repo supplies a production input, a challenger, or context only.

Carry forward

Promote only the outputs that survive source versioning, leakage checks, and outcome validation.

classification priority 1 Interpretable satellite welfare proxies Interpretable housing-quality prior satellite welfare affluence buildings and settlement structure
source custody

Local path: prior art/mani-shailesh_satimage

Upstream: mani-shailesh/satimage

inputs
satellite image chips, Census 2011, SECC income labels
method
Targets roof material, lighting source, and drinking-water source as interpretable welfare proxies.
outputs
roof probabilities, lighting probabilities, water-source probabilities
tam use
Use outputs as reason-code-friendly welfare signals for target-income probability.
gate
manual image QA for representative cells
Inputs stage 1 Processing stage 2 Features stage 3 Validation stage 4 TAM use stage 5 population household denominator buildings and settlement structure satellite welfare affluence nightlights and economic activity roads accessibility serviceability poi urban function land use exclusions and risk heterogeneous graph and spatial context internal business reality Signal coverage sketch cells, sources, and validation gates must be versioned before modeling 1 2 3 4 5 6 7 Graph and crosswalk lens Interpretable satellite welfare proxies
what it does

Core Behavior

  • Predicts developmental parameters from satellite images using a multi-task fully convolutional model.
  • Targets roof material, lighting source, and drinking-water source as interpretable welfare proxies.
  • Uses predicted or actual developmental parameters to estimate income/poverty levels.
  • Includes model weights, sample data, filter responses, and learning-curve materials.
model input

Inputs

  • satellite image chips
  • Census 2011
  • SECC income labels
  • region coordinates
model output

Outputs

  • roof probabilities
  • lighting probabilities
  • water-source probabilities
  • income/poverty predictions
tam role

How It Helps TAM

  • Use outputs as reason-code-friendly welfare signals for target-income probability.
  • Translate roof/lighting/water predictions into interpretable affluence bands.
  • Pair with current nightlight and building features for freshness.
promotion gate

Validation Gates

  • manual image QA for representative cells
  • spatial holdout by region
  • calibrate old census/SECC targets against internal ARPU/conversion
watch

Risks And Caveats

  • Satellite visual proxies can encode rural housing better than apartment-heavy urban density.
  • Static Maps inputs and old labels need modern replacement.
fit bars

Feature-Family Fit

population household denominator

buildings and settlement structure

satellite welfare affluence

nightlights and economic activity

roads accessibility serviceability

poi urban function

land use exclusions and risk

heterogeneous graph and spatial context

internal business reality

XVI Prior art 13 - India-specific academic reference pp. 49-51

Socio-economic indicators using satellite imagery

Contains notebooks and thesis material for satellite-based socioeconomic indicator estimation.

You are here in the mindmap
This section belongs to Map 16 - India-specific academic reference.
Story role

Decide whether this repo supplies a production input, a challenger, or context only.

Carry forward

Promote only the outputs that survive source versioning, leakage checks, and outcome validation.

classification priority 4 India-specific academic reference Optional context satellite welfare affluence
source custody

Local path: prior art/ArmaanBhullar_Socio-Economic-Indicators-using-Satellite-Imagery

Upstream: ArmaanBhullar/Socio-Economic-Indicators-using-Satellite-Imagery

inputs
selected villages, satellite-derived features, socioeconomic indicators
method
Includes village selection, data analysis, PCA, regression, and feature notes.
outputs
analysis notebooks, PCA outputs, regression outputs
tam use
Use as optional background for indicator engineering and notebook narrative.
gate
notebook cell length standards apply before edits
Inputs stage 1 Processing stage 2 Features stage 3 Validation stage 4 TAM use stage 5 population household denominator buildings and settlement structure satellite welfare affluence nightlights and economic activity roads accessibility serviceability poi urban function land use exclusions and risk heterogeneous graph and spatial context internal business reality Signal coverage sketch cells, sources, and validation gates must be versioned before modeling 1 2 3 4 5 6 7 Graph and crosswalk lens India-specific academic reference
what it does

Core Behavior

  • Contains notebooks and thesis material for satellite-based socioeconomic indicator estimation.
  • Includes village selection, data analysis, PCA, regression, and feature notes.
  • Acts as a lightweight India-specific academic reference rather than a production toolkit.
  • Can help compare explanatory notebook style and feature lists.
model input

Inputs

  • selected villages
  • satellite-derived features
  • socioeconomic indicators
model output

Outputs

  • analysis notebooks
  • PCA outputs
  • regression outputs
tam role

How It Helps TAM

  • Use as optional background for indicator engineering and notebook narrative.
  • Do not prioritize over EOML, Village Development Model, or satimage.
  • Mine only if it contains a useful feature or validation idea.
promotion gate

Validation Gates

  • notebook cell length standards apply before edits
  • features must be reconciled to current source manifests
  • metrics must not be copied without leakage review
watch

Risks And Caveats

  • Sparse repository and limited maintenance.
  • Likely not enough for operational India-wide scoring.
fit bars

Feature-Family Fit

population household denominator

buildings and settlement structure

satellite welfare affluence

nightlights and economic activity

roads accessibility serviceability

poi urban function

land use exclusions and risk

heterogeneous graph and spatial context

internal business reality

XVII Prior art 14 - India socioeconomic geography backbone pp. 52-54

SHRUG: Socioeconomic High-resolution Rural-Urban Geographic Platform for India

Tracks releases and issues for SHRUG, the India rural-urban socioeconomic geography platform.

You are here in the mindmap
This section belongs to Map 17 - India socioeconomic geography backbone.
Story role

Decide whether this repo supplies a production input, a challenger, or context only.

Carry forward

Promote only the outputs that survive source versioning, leakage checks, and outcome validation.

classification priority 1 India socioeconomic geography backbone Must-use backbone population household denominator satellite welfare affluence nightlights and economic activity
source custody

Local path: prior art/devdatalab_shrug-public

Upstream: devdatalab/shrug-public

inputs
SHRUG releases, village/town polygons, socioeconomic tables
method
Connects villages, towns, administrative geography, socioeconomic fields, environmental data, and nightlights.
outputs
SHRID geography, socioeconomic joins, rural/urban indicators
tam use
Use for village/town socioeconomic reconciliation, denominator checks, and geographic crosswalks.
gate
release version and license must be documented
Inputs stage 1 Processing stage 2 Features stage 3 Validation stage 4 TAM use stage 5 population household denominator buildings and settlement structure satellite welfare affluence nightlights and economic activity roads accessibility serviceability poi urban function land use exclusions and risk heterogeneous graph and spatial context internal business reality Signal coverage sketch cells, sources, and validation gates must be versioned before modeling 1 2 3 4 5 6 7 Graph and crosswalk lens India socioeconomic geography backbone
what it does

Core Behavior

  • Tracks releases and issues for SHRUG, the India rural-urban socioeconomic geography platform.
  • Connects villages, towns, administrative geography, socioeconomic fields, environmental data, and nightlights.
  • Provides high-resolution India geography and socioeconomic context outside vendor TAM.
  • Acts as a reconciliation backbone for Census, boundaries, villages, towns, and indicators.
model input

Inputs

  • SHRUG releases
  • village/town polygons
  • socioeconomic tables
  • nightlights
model output

Outputs

  • SHRID geography
  • socioeconomic joins
  • rural/urban indicators
  • release metadata
tam role

How It Helps TAM

  • Use for village/town socioeconomic reconciliation, denominator checks, and geographic crosswalks.
  • Use SHRUG fields as independent welfare/context features after licensing and versioning.
  • Use for city/rural holdout segmentation and geographic rollups.
promotion gate

Validation Gates

  • release version and license must be documented
  • cell-to-SHRID join success required
  • fields must be dated and not target-derived
watch

Risks And Caveats

  • Release data may sit outside the GitHub issue repo.
  • Some licensing terms may restrict commercial use.
fit bars

Feature-Family Fit

population household denominator

buildings and settlement structure

satellite welfare affluence

nightlights and economic activity

roads accessibility serviceability

poi urban function

land use exclusions and risk

heterogeneous graph and spatial context

internal business reality

XVIII Prior art 15 - India geodata aggregator pp. 55-57

India Geodata: unified open India geospatial data collection

Aggregates India administrative, census, environment, water, infrastructure, buildings, healthcare, education, urban, postal, police, and remote-sensing layers.

You are here in the mindmap
This section belongs to Map 18 - India geodata aggregator.
Story role

Decide whether this repo supplies a production input, a challenger, or context only.

Carry forward

Promote only the outputs that survive source versioning, leakage checks, and outcome validation.

classification priority 1 India geodata aggregator Local feature backbone population household denominator roads accessibility serviceability poi urban function land use exclusions and risk nightlights and economic activity
source custody

Local path: prior art/yashveeeeeeer_india-geodata

Upstream: yashveeeeeeer/india-geodata

inputs
government geodata, open community datasets, remote-sensing panels
method
Provides README and metadata files for many data directories.
outputs
GeoJSON, Parquet, PMTiles
tam use
Use as the first local source registry for independent features.
gate
each layer needs its own source status
Inputs stage 1 Processing stage 2 Features stage 3 Validation stage 4 TAM use stage 5 population household denominator buildings and settlement structure satellite welfare affluence nightlights and economic activity roads accessibility serviceability poi urban function land use exclusions and risk heterogeneous graph and spatial context internal business reality Signal coverage sketch cells, sources, and validation gates must be versioned before modeling 1 2 3 4 5 6 7 Graph and crosswalk lens India geodata aggregator
what it does

Core Behavior

  • Aggregates India administrative, census, environment, water, infrastructure, buildings, healthcare, education, urban, postal, police, and remote-sensing layers.
  • Provides README and metadata files for many data directories.
  • Contains local layers already consumed by the GeoHG-style feature builder.
  • Offers immediate local sources for POIs, nightlights, flood, soil, roads, boundaries, and slum overlaps.
model input

Inputs

  • government geodata
  • open community datasets
  • remote-sensing panels
  • curated metadata
model output

Outputs

  • GeoJSON
  • Parquet
  • PMTiles
  • CSV
  • shapefiles
  • metadata
tam role

How It Helps TAM

  • Use as the first local source registry for independent features.
  • Promote each layer separately only after coverage, license, CRS, and null-rate checks.
  • Use metadata and README files to keep feature provenance explicit.
promotion gate

Validation Gates

  • each layer needs its own source status
  • worldcover gap must remain marked missing until filled
  • coverage by vendor cities and national AOI must be reported
watch

Risks And Caveats

  • Aggregator convenience can hide upstream source differences.
  • Large files and release assets may not all be local.
fit bars

Feature-Family Fit

population household denominator

buildings and settlement structure

satellite welfare affluence

nightlights and economic activity

roads accessibility serviceability

poi urban function

land use exclusions and risk

heterogeneous graph and spatial context

internal business reality

XIX Prior art 16 - Boundary backbone pp. 58-60

Indian administrative boundaries

Publishes Indian administrative boundary releases for states, districts, subdistricts, blocks, panchayats, villages, habitations, urban areas, forests, postal, police, constituencies, and historical districts.

You are here in the mindmap
This section belongs to Map 19 - Boundary backbone.
Story role

Decide whether this repo supplies a production input, a challenger, or context only.

Carry forward

Promote only the outputs that survive source versioning, leakage checks, and outcome validation.

classification priority 1 Boundary backbone Critical join infrastructure population household denominator land use exclusions and risk
source custody

Local path: prior art/ramSeraph_indian_admin_boundaries

Upstream: ramSeraph/indian_admin_boundaries

inputs
LGD, SOI, Bhuvan
method
Emphasizes Survey of India guidance around political boundary standards.
outputs
boundary layers, admin crosswalk inputs, release artifacts
tam use
Use to attach cells to state, district, subdistrict, village, panchayat, urban, postal, and police units.
gate
join success per admin level required
Inputs stage 1 Processing stage 2 Features stage 3 Validation stage 4 TAM use stage 5 population household denominator buildings and settlement structure satellite welfare affluence nightlights and economic activity roads accessibility serviceability poi urban function land use exclusions and risk heterogeneous graph and spatial context internal business reality Signal coverage sketch cells, sources, and validation gates must be versioned before modeling 1 2 3 4 5 6 7 Graph and crosswalk lens Boundary backbone
what it does

Core Behavior

  • Publishes Indian administrative boundary releases for states, districts, subdistricts, blocks, panchayats, villages, habitations, urban areas, forests, postal, police, constituencies, and historical districts.
  • Emphasizes Survey of India guidance around political boundary standards.
  • Provides a multi-level spatial backbone for joining grid cells to official geography.
  • Connects naturally to indianopenmaps for tile deployment.
model input

Inputs

  • LGD
  • SOI
  • Bhuvan
  • PMGSY
  • FSI
  • NCSCM
  • release assets
model output

Outputs

  • boundary layers
  • admin crosswalk inputs
  • release artifacts
tam role

How It Helps TAM

  • Use to attach cells to state, district, subdistrict, village, panchayat, urban, postal, and police units.
  • Use as a cross-check against india-geodata and SHRUG boundaries.
  • Record unresolved or conflicting cells as confidence penalties.
promotion gate

Validation Gates

  • join success per admin level required
  • boundary source version required
  • conflict report required before rollups
watch

Risks And Caveats

  • Boundary systems can disagree; do not silently merge.
  • Official-looking boundaries can still be outdated relative to current admin changes.
fit bars

Feature-Family Fit

population household denominator

buildings and settlement structure

satellite welfare affluence

nightlights and economic activity

roads accessibility serviceability

poi urban function

land use exclusions and risk

heterogeneous graph and spatial context

internal business reality

XX Prior art 17 - Building footprints pp. 61-63

Indian buildings: urban, Google Open Buildings, and Microsoft Buildings

Collects Indian building footprint releases from urban sources, Google Open Buildings 2023, and Microsoft Buildings.

You are here in the mindmap
This section belongs to Map 20 - Building footprints.
Story role

Decide whether this repo supplies a production input, a challenger, or context only.

Carry forward

Promote only the outputs that survive source versioning, leakage checks, and outcome validation.

classification priority 1 Building footprints Core physical denominator source buildings and settlement structure population household denominator
source custody

Local path: prior art/ramSeraph_indian_buildings

Upstream: ramSeraph/indian_buildings

inputs
urban building footprints, Google Open Buildings, Microsoft Buildings
method
Provides a physical settlement and structure layer independent of vendor TAM.
outputs
building footprints, built area features, building-count features
tam use
Use for household redistribution and residential confidence after source disagreement checks.
gate
coverage and confidence threshold by source required
Inputs stage 1 Processing stage 2 Features stage 3 Validation stage 4 TAM use stage 5 population household denominator buildings and settlement structure satellite welfare affluence nightlights and economic activity roads accessibility serviceability poi urban function land use exclusions and risk heterogeneous graph and spatial context internal business reality Signal coverage sketch cells, sources, and validation gates must be versioned before modeling 1 2 3 4 5 6 7 Graph and crosswalk lens Building footprints
what it does

Core Behavior

  • Collects Indian building footprint releases from urban sources, Google Open Buildings 2023, and Microsoft Buildings.
  • Provides a physical settlement and structure layer independent of vendor TAM.
  • Supports building count, built area, compactness, and occupancy proxy features.
  • Helps identify empty land, industrial sheds, and high-density residential pockets.
model input

Inputs

  • urban building footprints
  • Google Open Buildings
  • Microsoft Buildings
model output

Outputs

  • building footprints
  • built area features
  • building-count features
tam role

How It Helps TAM

  • Use for household redistribution and residential confidence after source disagreement checks.
  • Compare Google and Microsoft disagreement cells for confidence scoring.
  • Never treat footprint count as household count without occupancy calibration.
promotion gate

Validation Gates

  • coverage and confidence threshold by source required
  • vertical-density caveat required in dense cities
  • validate against installable address density
watch

Risks And Caveats

  • High-rise households are underrepresented by footprint counts.
  • Industrial/commercial footprints can inflate residential confidence.
fit bars

Feature-Family Fit

population household denominator

buildings and settlement structure

satellite welfare affluence

nightlights and economic activity

roads accessibility serviceability

poi urban function

land use exclusions and risk

heterogeneous graph and spatial context

internal business reality

XXI Prior art 18 - Land masks and physical constraints pp. 64-66

Indian land features: land use, soil, forests, mining, elevation, degradation

Publishes Indian land-use, urban land-use, soil health, geomorphology, geology, forests, mining, groundwater prospects, elevation, and land degradation layers.

You are here in the mindmap
This section belongs to Map 21 - Land masks and physical constraints.
Story role

Decide whether this repo supplies a production input, a challenger, or context only.

Carry forward

Promote only the outputs that survive source versioning, leakage checks, and outcome validation.

classification priority 1 Land masks and physical constraints False-positive suppression source land use exclusions and risk roads accessibility serviceability
source custody

Local path: prior art/ramSeraph_indian_land_features

Upstream: ramSeraph/indian_land_features

inputs
land-use releases, soil, forests
method
Provides physical and environmental constraints for cell scoring.
outputs
mask layers, risk flags, terrain features
tam use
Use for land/water/forest/mining/terrain penalties and non-residential suppression.
gate
mask coverage and date required
Inputs stage 1 Processing stage 2 Features stage 3 Validation stage 4 TAM use stage 5 population household denominator buildings and settlement structure satellite welfare affluence nightlights and economic activity roads accessibility serviceability poi urban function land use exclusions and risk heterogeneous graph and spatial context internal business reality Signal coverage sketch cells, sources, and validation gates must be versioned before modeling 1 2 3 4 5 6 7 Graph and crosswalk lens Land masks and physical constraints
what it does

Core Behavior

  • Publishes Indian land-use, urban land-use, soil health, geomorphology, geology, forests, mining, groundwater prospects, elevation, and land degradation layers.
  • Provides physical and environmental constraints for cell scoring.
  • Helps separate residential opportunity from forest, mining, water-adjacent, industrial, steep, or degraded land.
  • Complements land-cover rasters with India-specific thematic data.
model input

Inputs

  • land-use releases
  • soil
  • forests
  • mining
  • CartoDEM
  • SOI elevation
model output

Outputs

  • mask layers
  • risk flags
  • terrain features
  • land viability features
tam role

How It Helps TAM

  • Use for land/water/forest/mining/terrain penalties and non-residential suppression.
  • Build explicit negative reason codes for low-confidence cells.
  • Keep masking effects visible so analysts can override with field evidence.
promotion gate

Validation Gates

  • mask coverage and date required
  • manual QA on suppressed high-demand cells
  • failed-install and serviceability validation preferred
watch

Risks And Caveats

  • Land-use layers may be stale or coarse.
  • Over-aggressive masks can remove real dense settlements.
fit bars

Feature-Family Fit

population household denominator

buildings and settlement structure

satellite welfare affluence

nightlights and economic activity

roads accessibility serviceability

poi urban function

land use exclusions and risk

heterogeneous graph and spatial context

internal business reality

XXII Prior art 19 - Map serving and local QA pp. 67-69

Indian Open Maps: tiles, PMTiles, COGs, and extraction workflows

Serves India vector/raster tiles from PMTiles and cloud-optimized geospatial files.

You are here in the mindmap
This section belongs to Map 22 - Map serving and local QA.
Story role

Decide whether this repo supplies a production input, a challenger, or context only.

Carry forward

Promote only the outputs that survive source versioning, leakage checks, and outcome validation.

classification priority 2 Map serving and local QA Useful for visual QA tooling land use exclusions and risk poi urban function
source custody

Local path: prior art/ramSeraph_indianopenmaps

Upstream: ramSeraph/indianopenmaps

inputs
PMTiles, COGs, boundary releases
method
Includes Python and processing utilities for extraction and filtering.
outputs
map tiles, extracts, visual QA layers
tam use
Use to make grid, feature, mask, and residual layers inspectable by operations teams.
gate
tile build metadata required
Inputs stage 1 Processing stage 2 Features stage 3 Validation stage 4 TAM use stage 5 population household denominator buildings and settlement structure satellite welfare affluence nightlights and economic activity roads accessibility serviceability poi urban function land use exclusions and risk heterogeneous graph and spatial context internal business reality Signal coverage sketch cells, sources, and validation gates must be versioned before modeling 1 2 3 4 5 6 7 Graph and crosswalk lens Map serving and local QA
what it does

Core Behavior

  • Serves India vector/raster tiles from PMTiles and cloud-optimized geospatial files.
  • Includes Python and processing utilities for extraction and filtering.
  • Turns large boundary/source layers into web map layers for QA and exploration.
  • Supports a local visual explorer for grids, masks, and feature disagreement.
model input

Inputs

  • PMTiles
  • COGs
  • boundary releases
  • feature layers
model output

Outputs

  • map tiles
  • extracts
  • visual QA layers
tam role

How It Helps TAM

  • Use to make grid, feature, mask, and residual layers inspectable by operations teams.
  • Prefer visual QA for source coverage and suspicious high/low cells.
  • Do not treat map-serving machinery as a model signal.
promotion gate

Validation Gates

  • tile build metadata required
  • visual layers must link to source versions
  • QA maps should show uncertainty/confidence
watch

Risks And Caveats

  • Visualization can look authoritative even when source coverage is partial.
  • Tile generation is not a substitute for numeric validation.
fit bars

Feature-Family Fit

population household denominator

buildings and settlement structure

satellite welfare affluence

nightlights and economic activity

roads accessibility serviceability

poi urban function

land use exclusions and risk

heterogeneous graph and spatial context

internal business reality

XXIII Prior art 20 - City ward and municipal overlays pp. 70-72

DataMeet Municipal Spatial Data

Collects municipal spatial data scraped from city websites and other sources.

You are here in the mindmap
This section belongs to Map 23 - City ward and municipal overlays.
Story role

Decide whether this repo supplies a production input, a challenger, or context only.

Carry forward

Promote only the outputs that survive source versioning, leakage checks, and outcome validation.

classification priority 1 City ward and municipal overlays Important urban overlay population household denominator poi urban function
source custody

Local path: prior art/datameet_Municipal_Spatial_Data

Upstream: datameet/Municipal_Spatial_Data

inputs
municipality websites, KML, GeoJSON
method
Provides KML and GeoJSON municipal ward and city layers for many Indian cities.
outputs
municipal ward polygons, city administrative overlays
tam use
Use for city rollups, ward-level planning, and field-ops overlays where available.
gate
city-specific source attribution required
Inputs stage 1 Processing stage 2 Features stage 3 Validation stage 4 TAM use stage 5 population household denominator buildings and settlement structure satellite welfare affluence nightlights and economic activity roads accessibility serviceability poi urban function land use exclusions and risk heterogeneous graph and spatial context internal business reality Signal coverage sketch cells, sources, and validation gates must be versioned before modeling 1 2 3 4 5 6 7 Graph and crosswalk lens City ward and municipal overlays
what it does

Core Behavior

  • Collects municipal spatial data scraped from city websites and other sources.
  • Provides KML and GeoJSON municipal ward and city layers for many Indian cities.
  • Documents that these are usually municipal wards, not Census wards.
  • Gives city operations overlays for aggregation, QA, and local planning.
model input

Inputs

  • municipality websites
  • KML
  • GeoJSON
  • city ward data
model output

Outputs

  • municipal ward polygons
  • city administrative overlays
tam role

How It Helps TAM

  • Use for city rollups, ward-level planning, and field-ops overlays where available.
  • Mark municipal ward versus census ward distinctions explicitly.
  • Attach ward coverage as a confidence attribute.
promotion gate

Validation Gates

  • city-specific source attribution required
  • ward type must be labeled
  • coverage gaps must be visible in reports
watch

Risks And Caveats

  • Coverage varies by city.
  • Municipal wards are not always stable or comparable across sources.
fit bars

Feature-Family Fit

population household denominator

buildings and settlement structure

satellite welfare affluence

nightlights and economic activity

roads accessibility serviceability

poi urban function

land use exclusions and risk

heterogeneous graph and spatial context

internal business reality

XXIV Prior art 21 - Village boundary backup pp. 73-75

DataMeet Indian village boundaries

Collects community-contributed Indian village boundaries for selected states.

You are here in the mindmap
This section belongs to Map 24 - Village boundary backup.
Story role

Decide whether this repo supplies a production input, a challenger, or context only.

Carry forward

Promote only the outputs that survive source versioning, leakage checks, and outcome validation.

classification priority 3 Village boundary backup Historical/community backup population household denominator
source custody

Local path: prior art/datameet_indian_village_boundaries

Upstream: datameet/indian_village_boundaries

inputs
community boundary files, state folders, docs
method
Provides historical open village boundary material and a website/docs structure.
outputs
village polygons, state-specific boundary layers
tam use
Use only as a fallback boundary source or QA comparison.
gate
compare against SHRUG/ramSeraph first
Inputs stage 1 Processing stage 2 Features stage 3 Validation stage 4 TAM use stage 5 population household denominator buildings and settlement structure satellite welfare affluence nightlights and economic activity roads accessibility serviceability poi urban function land use exclusions and risk heterogeneous graph and spatial context internal business reality Signal coverage sketch cells, sources, and validation gates must be versioned before modeling 1 2 3 4 5 6 7 Graph and crosswalk lens Village boundary backup
what it does

Core Behavior

  • Collects community-contributed Indian village boundaries for selected states.
  • Provides historical open village boundary material and a website/docs structure.
  • Can help compare or backfill village geography when primary sources are missing.
  • Is less preferred than SHRUG, india-geodata, or ramSeraph for serious modeling.
model input

Inputs

  • community boundary files
  • state folders
  • docs
model output

Outputs

  • village polygons
  • state-specific boundary layers
tam role

How It Helps TAM

  • Use only as a fallback boundary source or QA comparison.
  • Never silently replace a primary source with this layer.
  • Record source priority and unresolved-cell count.
promotion gate

Validation Gates

  • compare against SHRUG/ramSeraph first
  • manual QA for selected states
  • source age and coverage required
watch

Risks And Caveats

  • Coverage and accuracy vary widely.
  • Can introduce join inconsistencies if mixed without metadata.
fit bars

Feature-Family Fit

population household denominator

buildings and settlement structure

satellite welfare affluence

nightlights and economic activity

roads accessibility serviceability

poi urban function

land use exclusions and risk

heterogeneous graph and spatial context

internal business reality

XXV Prior art 22 - Census denominator reference pp. 76-78

India Census 2011 PCA and houselisting mirror

Contains scraped Census 2011 PCA and houselisting-style tables.

You are here in the mindmap
This section belongs to Map 25 - Census denominator reference.
Story role

Decide whether this repo supplies a production input, a challenger, or context only.

Carry forward

Promote only the outputs that survive source versioning, leakage checks, and outcome validation.

classification priority 2 Census denominator reference Useful reproducibility mirror population household denominator satellite welfare affluence
source custody

Local path: prior art/pigshell_india-census-2011

Upstream: pigshell/india-census-2011

inputs
Census 2011 PCA, houselisting tables, scraped records
method
Provides a reproducible mirror for population and housing statistics.
outputs
CSV/table extracts, population and housing fields
tam use
Use for quick denominator reconciliation and housing feature probes.
gate
official-source comparison required
Inputs stage 1 Processing stage 2 Features stage 3 Validation stage 4 TAM use stage 5 population household denominator buildings and settlement structure satellite welfare affluence nightlights and economic activity roads accessibility serviceability poi urban function land use exclusions and risk heterogeneous graph and spatial context internal business reality Signal coverage sketch cells, sources, and validation gates must be versioned before modeling 1 2 3 4 5 6 7 Graph and crosswalk lens Census denominator reference
what it does

Core Behavior

  • Contains scraped Census 2011 PCA and houselisting-style tables.
  • Provides a reproducible mirror for population and housing statistics.
  • Can be used for denominator QA, household/housing variables, and district rollups.
  • Should be secondary to official Census tables when available.
model input

Inputs

  • Census 2011 PCA
  • houselisting tables
  • scraped records
model output

Outputs

  • CSV/table extracts
  • population and housing fields
tam role

How It Helps TAM

  • Use for quick denominator reconciliation and housing feature probes.
  • Prefer official Census source for final source registry.
  • Document age and projection/calibration method before current TAM use.
promotion gate

Validation Gates

  • official-source comparison required
  • join-key audit required
  • staleness note required
watch

Risks And Caveats

  • Scraped data may contain errors.
  • 2011 values are stale for current city growth.
fit bars

Feature-Family Fit

population household denominator

buildings and settlement structure

satellite welfare affluence

nightlights and economic activity

roads accessibility serviceability

poi urban function

land use exclusions and risk

heterogeneous graph and spatial context

internal business reality

XXVI Prior art 23 - Postal overlay pp. 79-81

DataMeet pincode boundaries

Provides GeoJSON pincode boundary extents for several major Indian cities.

You are here in the mindmap
This section belongs to Map 26 - Postal overlay.
Story role

Decide whether this repo supplies a production input, a challenger, or context only.

Carry forward

Promote only the outputs that survive source versioning, leakage checks, and outcome validation.

classification priority 2 Postal overlay Address QA overlay roads accessibility serviceability poi urban function
source custody

Local path: prior art/datameet_PincodeBoundary

Upstream: datameet/PincodeBoundary

inputs
pincode polygons, city folders, GeoJSON
method
Helps connect grid cells to address and postal operating workflows.
outputs
postal overlays, city pincode boundaries
tam use
Use for pincode-level QA, address mismatch checks, and operational summaries.
gate
city coverage required
Inputs stage 1 Processing stage 2 Features stage 3 Validation stage 4 TAM use stage 5 population household denominator buildings and settlement structure satellite welfare affluence nightlights and economic activity roads accessibility serviceability poi urban function land use exclusions and risk heterogeneous graph and spatial context internal business reality Signal coverage sketch cells, sources, and validation gates must be versioned before modeling 1 2 3 4 5 6 7 Graph and crosswalk lens Postal overlay
what it does

Core Behavior

  • Provides GeoJSON pincode boundary extents for several major Indian cities.
  • Helps connect grid cells to address and postal operating workflows.
  • Works as a practical overlay for geocoding QA, field planning, and pincode summaries.
  • Should not be treated as perfect official postal ground truth.
model input

Inputs

  • pincode polygons
  • city folders
  • GeoJSON
model output

Outputs

  • postal overlays
  • city pincode boundaries
tam role

How It Helps TAM

  • Use for pincode-level QA, address mismatch checks, and operational summaries.
  • Keep pincode-derived features as routing/ops metadata, not income labels.
  • Compare to other postal sources where important.
promotion gate

Validation Gates

  • city coverage required
  • postal source caveat required
  • manual QA for disputed boundaries
watch

Risks And Caveats

  • Pincode polygons are approximate.
  • Coverage is limited to selected cities.
fit bars

Feature-Family Fit

population household denominator

buildings and settlement structure

satellite welfare affluence

nightlights and economic activity

roads accessibility serviceability

poi urban function

land use exclusions and risk

heterogeneous graph and spatial context

internal business reality

XXVII Prior art 24 - Postal shape construction pp. 82-84

Pincode shapes: editable India pincode GeoJSON workflow

Provides a workflow for seeding, editing, and downloading India pincode boundaries as GeoJSON.

You are here in the mindmap
This section belongs to Map 27 - Postal shape construction.
Story role

Decide whether this repo supplies a production input, a challenger, or context only.

Carry forward

Promote only the outputs that survive source versioning, leakage checks, and outcome validation.

classification priority 3 Postal shape construction Useful QA concept roads accessibility serviceability
source custody

Local path: prior art/sanand0_pincode-shapes

Upstream: sanand0/pincode-shapes

inputs
pincode points, editable shapes, GeoJSON
method
Frames pincode coverage as an editable geospatial data problem.
outputs
pincode boundary candidates, downloadable shapes
tam use
Use as a workflow reference for correcting postal overlays.
gate
operator-edited shapes need provenance
Inputs stage 1 Processing stage 2 Features stage 3 Validation stage 4 TAM use stage 5 population household denominator buildings and settlement structure satellite welfare affluence nightlights and economic activity roads accessibility serviceability poi urban function land use exclusions and risk heterogeneous graph and spatial context internal business reality Signal coverage sketch cells, sources, and validation gates must be versioned before modeling 1 2 3 4 5 6 7 Graph and crosswalk lens Postal shape construction
what it does

Core Behavior

  • Provides a workflow for seeding, editing, and downloading India pincode boundaries as GeoJSON.
  • Frames pincode coverage as an editable geospatial data problem.
  • Can help with address/pincode QA workflows and operational map correction.
  • Is not a definitive socioeconomic or household source.
model input

Inputs

  • pincode points
  • editable shapes
  • GeoJSON
model output

Outputs

  • pincode boundary candidates
  • downloadable shapes
tam role

How It Helps TAM

  • Use as a workflow reference for correcting postal overlays.
  • Use in QA dashboards where teams need to inspect geocoding issues.
  • Do not use pincode geometry as a demand predictor by itself.
promotion gate

Validation Gates

  • operator-edited shapes need provenance
  • date and editor attribution required
  • must be separated from model labels
watch

Risks And Caveats

  • Editable shapes can drift without governance.
  • Pincode boundaries are operational, not demographic truth.
fit bars

Feature-Family Fit

population household denominator

buildings and settlement structure

satellite welfare affluence

nightlights and economic activity

roads accessibility serviceability

poi urban function

land use exclusions and risk

heterogeneous graph and spatial context

internal business reality

XXVIII Prior art 25 - Map layer backup pp. 85-87

Hindustan Times Labs shapefiles

Contains India, state, city, and other shapefile/GeoJSON/KML resources.

You are here in the mindmap
This section belongs to Map 28 - Map layer backup.
Story role

Decide whether this repo supplies a production input, a challenger, or context only.

Carry forward

Promote only the outputs that survive source versioning, leakage checks, and outcome validation.

classification priority 4 Map layer backup Visual/reference backup land use exclusions and risk
source custody

Local path: prior art/HindustanTimesLabs_shapefiles

Upstream: HindustanTimesLabs/shapefiles

inputs
shapefiles, GeoJSON, KML
method
Useful for quick maps and visual context when better sources are absent.
outputs
visual map layers, backup boundaries
tam use
Use only for exploratory visualization or missing-map backup.
gate
accuracy caveat required
Inputs stage 1 Processing stage 2 Features stage 3 Validation stage 4 TAM use stage 5 population household denominator buildings and settlement structure satellite welfare affluence nightlights and economic activity roads accessibility serviceability poi urban function land use exclusions and risk heterogeneous graph and spatial context internal business reality Signal coverage sketch cells, sources, and validation gates must be versioned before modeling 1 2 3 4 5 6 7 Graph and crosswalk lens Map layer backup
what it does

Core Behavior

  • Contains India, state, city, and other shapefile/GeoJSON/KML resources.
  • Useful for quick maps and visual context when better sources are absent.
  • Carries source notes and accuracy caveats.
  • Should remain backup/reference material for this project.
model input

Inputs

  • shapefiles
  • GeoJSON
  • KML
  • state/city folders
model output

Outputs

  • visual map layers
  • backup boundaries
tam role

How It Helps TAM

  • Use only for exploratory visualization or missing-map backup.
  • Prefer SHRUG, india-geodata, and ramSeraph for production joins.
  • Make caveats visible in any report that includes it.
promotion gate

Validation Gates

  • accuracy caveat required
  • do not mix with official boundaries silently
  • manual QA required for planning use
watch

Risks And Caveats

  • Accuracy not guaranteed.
  • Layer age and source can vary.
fit bars

Feature-Family Fit

population household denominator

buildings and settlement structure

satellite welfare affluence

nightlights and economic activity

roads accessibility serviceability

poi urban function

land use exclusions and risk

heterogeneous graph and spatial context

internal business reality

XXIX Prior art 26 - Legacy boundary quickstart pp. 88-90

geohacker/india: simple India GeoJSON boundaries

Provides simple GeoJSON boundaries for Indian states, districts, and taluks.

You are here in the mindmap
This section belongs to Map 29 - Legacy boundary quickstart.
Story role

Decide whether this repo supplies a production input, a challenger, or context only.

Carry forward

Promote only the outputs that survive source versioning, leakage checks, and outcome validation.

classification priority 4 Legacy boundary quickstart Prototype-only backup population household denominator
source custody

Local path: prior art/geohacker_india

Upstream: geohacker/india

inputs
GADM-derived boundaries, GeoJSON
method
Useful for quick prototypes and lightweight map examples.
outputs
state boundaries, district boundaries, taluk boundaries
tam use
Use only for rough visual prototypes.
gate
prototype label required
Inputs stage 1 Processing stage 2 Features stage 3 Validation stage 4 TAM use stage 5 population household denominator buildings and settlement structure satellite welfare affluence nightlights and economic activity roads accessibility serviceability poi urban function land use exclusions and risk heterogeneous graph and spatial context internal business reality Signal coverage sketch cells, sources, and validation gates must be versioned before modeling 1 2 3 4 5 6 7 Graph and crosswalk lens Legacy boundary quickstart
what it does

Core Behavior

  • Provides simple GeoJSON boundaries for Indian states, districts, and taluks.
  • Useful for quick prototypes and lightweight map examples.
  • Does not provide the depth needed for serious grid-level TAM modeling.
  • Can be used as a sanity-check visual layer only.
model input

Inputs

  • GADM-derived boundaries
  • GeoJSON
model output

Outputs

  • state boundaries
  • district boundaries
  • taluk boundaries
tam role

How It Helps TAM

  • Use only for rough visual prototypes.
  • Avoid production joins or official rollups from this source.
  • Replace with current official or curated boundaries before modeling.
promotion gate

Validation Gates

  • prototype label required
  • source caveat required
  • do not use for metrics rollup
watch

Risks And Caveats

  • Legacy and likely stale.
  • Insufficient for city/local operational decisions.
fit bars

Feature-Family Fit

population household denominator

buildings and settlement structure

satellite welfare affluence

nightlights and economic activity

roads accessibility serviceability

poi urban function

land use exclusions and risk

heterogeneous graph and spatial context

internal business reality

XXX Prior art 27 - Boundary extraction workflow pp. 91-93

OS-Bhugol: converting government map documents into open geodata

Attempts to convert government ward/boundary PDFs and images into clean GeoJSON/KML data.

You are here in the mindmap
This section belongs to Map 30 - Boundary extraction workflow.
Story role

Decide whether this repo supplies a production input, a challenger, or context only.

Carry forward

Promote only the outputs that survive source versioning, leakage checks, and outcome validation.

classification priority 3 Boundary extraction workflow Watchlist workflow poi urban function population household denominator
source custody

Local path: prior art/mahanvyakti_OS-Bhugol

Upstream: mahanvyakti/OS-Bhugol

inputs
government PDFs, JPEG maps, manual/geometric extraction
method
Frames hard-to-use Indian boundary documents as open spatial data extraction tasks.
outputs
GeoJSON, KML, site documentation
tam use
Use as a workflow reference for gap-filling city ward layers.
gate
document source path required
Inputs stage 1 Processing stage 2 Features stage 3 Validation stage 4 TAM use stage 5 population household denominator buildings and settlement structure satellite welfare affluence nightlights and economic activity roads accessibility serviceability poi urban function land use exclusions and risk heterogeneous graph and spatial context internal business reality Signal coverage sketch cells, sources, and validation gates must be versioned before modeling 1 2 3 4 5 6 7 Graph and crosswalk lens Boundary extraction workflow
what it does

Core Behavior

  • Attempts to convert government ward/boundary PDFs and images into clean GeoJSON/KML data.
  • Frames hard-to-use Indian boundary documents as open spatial data extraction tasks.
  • Can be useful when city wards exist only as scanned maps or PDFs.
  • Current coverage appears narrow, so it is a workflow reference more than a base source.
model input

Inputs

  • government PDFs
  • JPEG maps
  • manual/geometric extraction
  • scripts
model output

Outputs

  • GeoJSON
  • KML
  • site documentation
tam role

How It Helps TAM

  • Use as a workflow reference for gap-filling city ward layers.
  • Apply only with strict manual QA and source attribution.
  • Store extracted boundaries as separate dated artifacts.
promotion gate

Validation Gates

  • document source path required
  • digitization QA required
  • do not mix with official layers without conflict report
watch

Risks And Caveats

  • Coverage is limited.
  • Digitized boundaries can contain geometric errors.
fit bars

Feature-Family Fit

population household denominator

buildings and settlement structure

satellite welfare affluence

nightlights and economic activity

roads accessibility serviceability

poi urban function

land use exclusions and risk

heterogeneous graph and spatial context

internal business reality

XXXI Appendix - upstream sources pp. 94-99

Static Upstream Source Appendix

These stable upstream sources and tooling references are not automatically model-ready; each needs version, extract date, license, CRS, coverage, and leakage-safe validation before promotion.

You are here in the mindmap
This section belongs to Map 31 - upstream registry.
Story role

Separate source discovery from production readiness.

Carry forward

Treat every source as a candidate until custody and coverage checks pass.

GHSL

Population/built-up priority 1

Independent population, built-up, and settlement benchmark.

Official Census India PCA

Denominator priority 1

Official population, household, housing, and rural/urban reconciliation.

Local Government Directory

Admin registry priority 1

Admin-code crosswalks across Census, SHRUG, boundaries, and internal systems.

ESA WorldCover

Land cover priority 1

Built-up, water, vegetation, crop, and non-residential masks.

Dynamic World V1

Land cover priority 2

Time-windowed land-cover probabilities for built-up and exclusion masks.

Google Open Buildings

Buildings priority 1

Building count, built area, settlement morphology, and residential-density evidence.

Microsoft Global ML Buildings

Buildings priority 1

Independent building-footprint source for denominator redistribution and QA.

Overture Maps

Roads/POIs snapshot

Versioned places, buildings, roads, addresses, and base features.

OSMnx and frozen OSM extracts

Roads/POIs snapshot

Roads, POIs, network topology, and accessibility features.

ohsome API

Coverage QA snapshot

OSM history and completeness statistics so sparse mapping is not mistaken for sparse demand.

Ookla Open Data

Connectivity snapshot

Quarterly broadband/mobile performance tiles as weak connectivity context.

M-Lab

Connectivity snapshot

Broadband measurement aggregates for independent connectivity residual analysis.

OpenCelliD

Connectivity snapshot

Cell tower locations as optional mobile infrastructure proxy.

Planetary Computer STAC

Raster access catalog

Reproducible raster catalog item IDs and query manifests.

DuckDB Spatial

Processing tool

Fast local spatial SQL for feature tables, probes, and crosswalks.

GeoParquet

Format tool

Columnar spatial artifacts with CRS and metadata.

PMTiles

Format tool

Compact distribution of QA map layers without a tile server.

IBM/NASA Prithvi

Foundation model advanced

Foundation model embeddings for land cover and environmental context.

Clay Foundation

Foundation model advanced

General satellite embeddings for welfare or settlement morphology residuals.

AllenAI SatlasPretrain

Foundation model advanced

Remote-sensing pretrained models for buildings, roads, land use, and visual priors.

TerraTorch

Framework advanced

Training and evaluation framework for geospatial foundation models.

XXXII Appendix - adoption order pp. 100-103

Adoption Matrix

Use this as the implementation order. It keeps the business formula auditable and avoids jumping straight from prior art to a black-box TAM score.

You are here in the mindmap
This section belongs to Map 32 - implementation order.
Story role

Turn prior-art reading into a build sequence.

Carry forward

Start with denominator and custody before adding embeddings or graph context.

StepLayerPrior artScore fieldGate
1 Denominator WorldPop, Census, SHRUG, POPCORN, buildings households_est district/city rollups
2 Residential confidence buildings, land use, WorldCover, land masks residential_confidence manual QA plus failed-install checks
3 Income/affluence proxy EOML, Village Development, satimage, nightlights income_band_prob Census/SHRUG/NFHS/internal ARPU
4 Serviceability roads, terrain, partner/network, failed installs serviceable_prob ops serviceability outcomes
5 Acquirability leads, installs, conversion, competition, channel coverage acquirable_prob time and spatial holdout
6 Graph context GeoHG, SRAI, Hex2Vec, Highway2Vec context features spatial-block and city holdout
XXXIII Appendix - repeated visual gates pp. 104-118

Visual Evidence Atlas

This dense visual appendix maps each prior-art item to feature families and repeats the gates that keep the work audit-safe.

You are here in the mindmap
This section belongs to Map 33 - repeated gate tiles.
Story role

Make the long tail scannable without flattening it into prose.

Carry forward

Read the tiles as prompts for validation, not as readiness scores.

XXXIV Appendix - vocabulary pp. 119-121

Glossary

The floating lingo panel is convenient on screen; this chapter keeps the same vocabulary available when the report is printed or archived.

You are here in the mindmap
This section belongs to Map 34 - vocabulary.
Story role

Keep the report's repeated terms unambiguous.

Carry forward

When a model artifact uses one of these terms, it should use the same meaning.

TermPlain-English meaning
Vendor TAMA benchmark or evaluation label only; never a production feature.
Spatial holdoutA validation split that withholds geographic areas, not random rows.
City holdoutA validation split that tests whether the model survives unseen cities.
DenominatorThe population, household, or building base before ability-to-buy adjustments.
Residential confidenceEvidence that a cell contains usable residential demand rather than empty built-up area.
ServiceabilityWhether the business can feasibly reach or install in the cell.
AcquirabilityWhether demand can be won through channels, price, and competition.
OSM completenessA guardrail that separates missing map data from missing demand.
GeoHGA heterogeneous graph prior art for area, semantic, and POI context.
DistillationA research step that approximates benchmark labels without allowing those labels into production features.